
Hi,
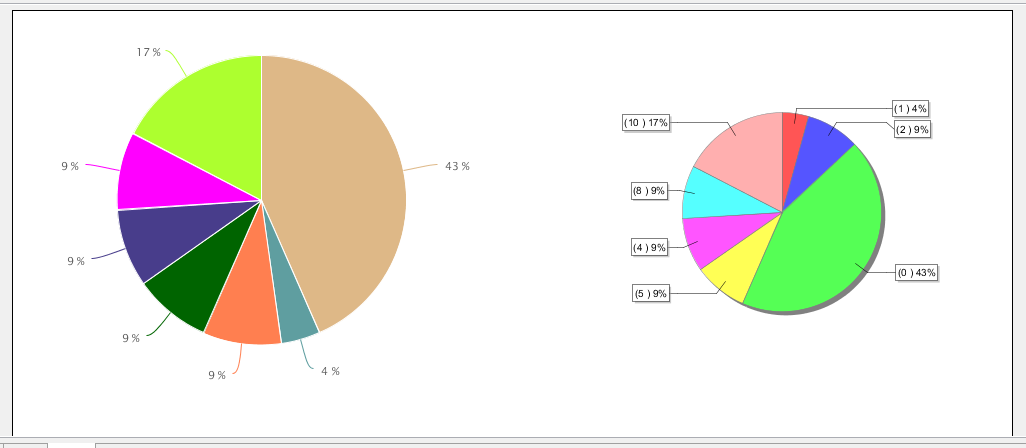
This post will give you the tips on displaying percentage values instead of usual category labels on HTML-5 pie chart and JFree chart.
There are many ways to get the percentage but this post is related with an use case.
Category and measure would be same field i.e, count of same value/total count of field values.
Software Used for the sample in this post
1) Jasper Design Studio Professional 6.0.1 (6.x)
2) PostgreSQL , a "test" database and a "DUMMY" table with the below shown data.
Use Case :
% calculation on a single field count in below query.(Taking category and measure field as same).
Analysis : (23 is the total count of the field)
number of 1's -1 ---> 1/23
number of 2's- 2 ----> 2/23
number of 0's-10 ----> 10/23
number of 5's -2 ------> 2/23
number of 4's-2 -------> 2/23
number of 8's-2 ------>2/23
number of 10's -4 ------> 4/23
SELECT * FROM DUMMY
field1 field2
a 1
b 2
c 2
m 0
n 0
o 0
p 0
q 0
r 0
s 0
t 0
u 0
v 0
m1 5
n1 5
o1 4
p1 4
q1 8
r1 8
s1 10
t1 10
u1 10
v1 10
How to ?
On HTML-5 Pie Chart.
On Title band
1) Drag and drop HTML 5 pie chart to Title band and right click on the chart
and be on "Chart properties" tab
2) Click on "Show Advanced Properties" tab at bottom right corner.
3) Click on "Add" button and give below property
Property Name = plotOptions.pie.dataLabels.format
Check "Use an expression" check box.
Property Value= " {point.percentage:.0f} % "
4) Click on Ok button and come back to main tabs of chart properties. i.e, click on "Chart Data"
Click on Configuration tab
Under "Category Level" click on "Level1" and give below for this use case.
Expression : $F{field2}
Value Class Name : java.lang.String
Order : Ascending
For conditional colors of slices - > Click on Bucket Properties and give below
Click on Add
Property Name : color
Property Expression :
$F{field2}.toString().equals("0") ? "#DEB887" : $F{field2}.toString().equals("1")? "#5F9EA0" : $F{field2}.toString().equals("2")? "#FF7F50" : $F{field2}.toString().equals("4")? "#006400" :
$F{field2}.toString().equals("5")? "#483D8B" : $F{field2}.toString().equals("8")? "#FF00FF" : "#ADFF2F"
5) Now come to "Value section"
Vale Definition Tab :
Label Expression : "Measure label expression"
Calculation : Count
Value Expression : $F{field2}
Value Class Name : java.lang.Integer
Advanced Properties
Click on Add
Contributor : SeriesItemProperty
Property Name : color
Use Bucket property value : Level1.color
JFree Chart :
To implement the JFree Bar chart for this particular data set and use case it is not as simple as we did for HTML-5.
We need to do below work around.
1) Create a group with $F{field2}
2) Create two variables (one is to find the total count of field2 and another is to find the count of same field when the group changes).
i.e.,
Variable_1
Name = Variable_1
Value Class Name = java.lang.Integer
Calculation = Count
Expression = $F{field2}
Increment Type = None
Reset Type = Report
Variable_2
Name = Variable_2
Value Class Name = java.lang.Integer
Calculation = Count
Expression = $F{field2}
Increment Type = None
Reset Type =[Group] Group1 (note that Group1 is the name of the group created)
3) Drag and drop JFree pie chart to "Title band" and right click on it and click on "Edit chart properties".
Give below properties on the windows.
Value = $V{Variable_2}
Key =$F{field2}.toString()
Click on "Finish" button and go the properties window of this chart .
Among 6 properties tabs for this chart, click on "Chart Plot" tab and go the "Labels" section.
Give Label Format = ({0} ) {2}
NOTE:
# Make sure created group by band height =0 to avoid empty spaces in the report.
# This report is not tested in Jaspeer server view but it should work.
That's all. you are done.!
Save the report and preview.
JRXML Code :
<?xml version="1.0" encoding="UTF-8"?>
<!-- Created with Jaspersoft Studio version 6.0.1.final using JasperReports Library version 6.0.0 -->
<!-- 2015-11-06T01:00:22 -->
<jasperReport xmlns="http://jasperreports.sourceforge.net/jasperreports" xmlns:xsi="http://www.w3.org/2001/XMLSchema-instance" xsi:schemaLocation="http://jasperreports.sourceforge.net/jasperreports http://jasperreports.sourceforge.net/xsd/jasperreport.xsd" name="Graph" pageWidth="1000" pageHeight="842" columnWidth="960" leftMargin="20" rightMargin="20" topMargin="20" bottomMargin="20" uuid="77404ba2-af1b-4f3a-be4c-93002d1edd4d">
<property name="com.jaspersoft.studio.data.defaultdataadapter" value="test_postgres"/>
<property name="com.jaspersoft.studio.unit." value="pixel"/>
<property name="com.jaspersoft.studio.unit.pageHeight" value="pixel"/>
<property name="com.jaspersoft.studio.unit.pageWidth" value="pixel"/>
<property name="com.jaspersoft.studio.unit.topMargin" value="pixel"/>
<property name="com.jaspersoft.studio.unit.bottomMargin" value="pixel"/>
<property name="com.jaspersoft.studio.unit.leftMargin" value="pixel"/>
<property name="com.jaspersoft.studio.unit.rightMargin" value="pixel"/>
<property name="com.jaspersoft.studio.unit.columnWidth" value="pixel"/>
<property name="com.jaspersoft.studio.unit.columnSpacing" value="pixel"/>
<queryString language="SQL">
<![CDATA[select * from dummy]]>
</queryString>
<field name="filed1" class="java.lang.String"/>
<field name="field2" class="java.lang.Integer"/>
<variable name="Variable_1" class="java.lang.Integer" calculation="Count">
<variableExpression><![CDATA[$F{field2}]]></variableExpression>
</variable>
<variable name="Variable_2" class="java.lang.Integer" resetType="Group" resetGroup="Group1" calculation="Count">
<variableExpression><![CDATA[$F{field2}]]></variableExpression>
</variable>
<group name="Group1">
<groupExpression><![CDATA[$F{field2}]]></groupExpression>
<groupHeader>
<band height="18"/>
</groupHeader>
</group>
<title>
<band height="369">
<pieChart>
<chart isShowLegend="false" evaluationTime="Report">
<reportElement x="540" y="0" width="420" height="369" uuid="fc0b804b-6c86-4cc8-845b-da2b015145f1"/>
<chartTitle/>
<chartSubtitle/>
<chartLegend/>
</chart>
<pieDataset>
<keyExpression><![CDATA[$F{field2}.toString()]]></keyExpression>
<valueExpression><![CDATA[$V{Variable_2}]]></valueExpression>
</pieDataset>
<piePlot labelFormat="({0} ) {2}" legendLabelFormat="{1}">
<plot/>
<itemLabel/>
</piePlot>
</pieChart>
<componentElement>
<reportElement x="0" y="0" width="467" height="369" uuid="bb305ca9-82de-4b15-91c1-4e285adf5640"/>
<hc:chart xmlns:hc="http://jaspersoft.com/highcharts" xsi:schemaLocation="http://jaspersoft.com/highcharts http://jaspersoft.com/schema/highcharts.xsd" type="Pie" evaluationTime="Report">
<hc:chartSetting name="default">
<hc:chartProperty name="chart.zoomType">
<hc:propertyExpression><![CDATA["xy"]]></hc:propertyExpression>
</hc:chartProperty>
<hc:chartProperty name="credits.enabled">
<hc:propertyExpression><![CDATA[false]]></hc:propertyExpression>
</hc:chartProperty>
<hc:chartProperty name="credits.href">
<hc:propertyExpression><![CDATA[""]]></hc:propertyExpression>
</hc:chartProperty>
<hc:chartProperty name="credits.text">
<hc:propertyExpression><![CDATA[""]]></hc:propertyExpression>
</hc:chartProperty>
<hc:chartProperty name="legend.enabled">
<hc:propertyExpression><![CDATA[boolean.FALSE]]></hc:propertyExpression>
</hc:chartProperty>
<hc:chartProperty name="plotOptions.pie.dataLabels.format">
<hc:propertyExpression><![CDATA[" {point.percentage:.0f} % "]]></hc:propertyExpression>
</hc:chartProperty>
<hc:chartProperty name="plotOptions.pie.showInLegend" value="false"/>
<hc:chartProperty name="title.text">
<hc:propertyExpression><![CDATA[""]]></hc:propertyExpression>
</hc:chartProperty>
<hc:chartProperty name="yAxis.title.text">
<hc:propertyExpression><![CDATA[""]]></hc:propertyExpression>
</hc:chartProperty>
</hc:chartSetting>
<multiAxisData>
<multiAxisDataset/>
<dataAxis axis="Rows">
<axisLevel name="Level1">
<labelExpression><![CDATA["Level Label expression"]]></labelExpression>
<axisLevelBucket class="java.lang.String">
<bucketExpression><![CDATA[$F{field2}]]></bucketExpression>
<bucketProperty name="color"><![CDATA[$F{field2}.toString().equals("0") ? "#DEB887" : $F{field2}.toString().equals("1")? "#5F9EA0" : $F{field2}.toString().equals("2")? "#FF7F50" : $F{field2}.toString().equals("4")? "#006400" :
$F{field2}.toString().equals("5")? "#483D8B" : $F{field2}.toString().equals("8")? "#FF00FF" : "#ADFF2F"
]]></bucketProperty>
</axisLevelBucket>
</axisLevel>
</dataAxis>
<multiAxisMeasure name="Measure1" class="java.lang.Integer" calculation="Count">
<labelExpression><![CDATA["Measure label expression"]]></labelExpression>
<valueExpression><![CDATA[$F{field2}]]></valueExpression>
</multiAxisMeasure>
</multiAxisData>
<hc:series name="Measure1">
<hc:contributor name="SeriesItemProperty">
<hc:contributorProperty name="color" valueType="Bucket" value="Level1.color"/>
</hc:contributor>
</hc:series>
</hc:chart>
</componentElement>
</band>
</title>
<summary>
<band height="33">
<property name="local_mesure_unitheight" value="pixel"/>
<property name="com.jaspersoft.studio.unit.height" value="px"/>
</band>
</summary>
</jasperReport>
References :
http://community.jaspersoft.com/wiki/html5-bar-chart-how-add-percent-sign-datalabel-and-change-its-font-size
http://community.jaspersoft.com/wiki/html5-pie-chart-percentage-display
http://community.jaspersoft.com/wiki/displaying-percentage-pie-chart-labels
http://davidhoppmann.com/2013/11/26/customizing-tooltips-in-jasperreports-html5-chart-components/
http://api.highcharts.com/highcharts#plotOptions.pie.dataLabels.format
Colors : http://www.w3schools.com/html/html_colornames.asp
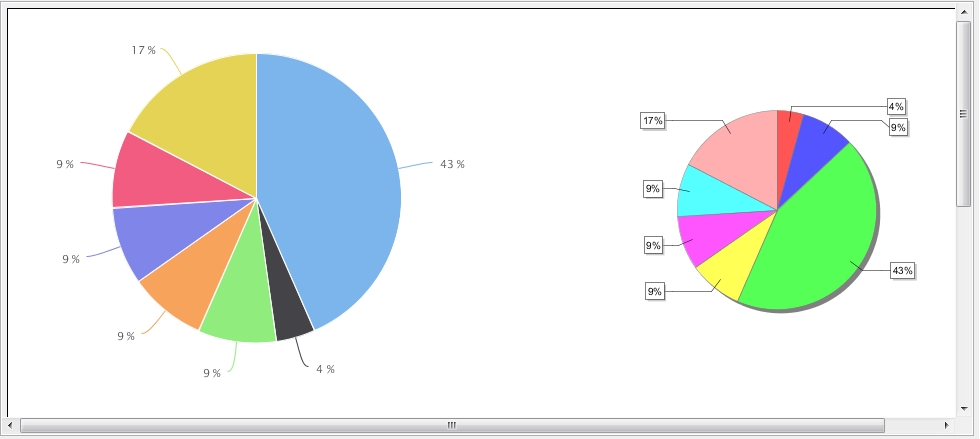
Recommended Comments
There are no comments to display.