
Hi,
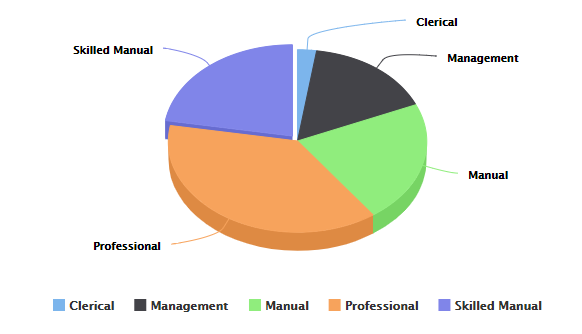
Convert a basic HTML-5 pie chart to have HTML-5 3D look and feel by setting up below advanced properties for the graph.

API properties:
chart: {
type: 'pie',
options3d: {
enabled: true,
alpha: 45,
beta: 0
}
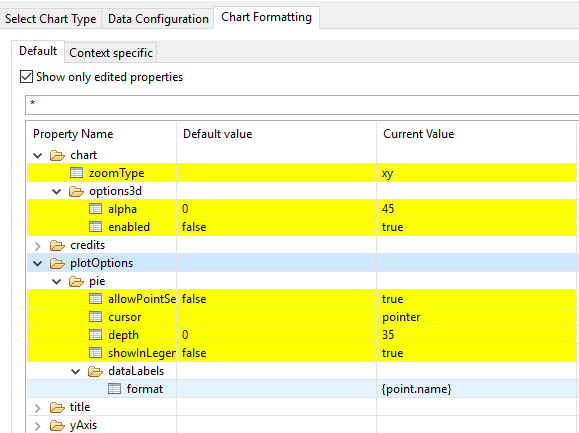
plotOptions: {
pie: {
allowPointSelect: true,
cursor: 'pointer',
depth: 35,
dataLabels: {
enabled: true,
format: '{point.name}'
}
}
How these are converted to pie chart advanced properties:
References:
https://www.highcharts.com/demo/3d-pie
https://jsfiddle.net/gh/get/library/pure/highcharts/highcharts/tree/master/samples/highcharts/demo/3d-pie/
JRXML (Supports in 7.2 pro or later)
<?xml version="1.0" encoding="UTF-8"?>
<!-- Created with Jaspersoft Studio version 7.2.0.final using JasperReports Library version 6.6.0 -->
<jasperReport xmlns="http://jasperreports.sourceforge.net/jasperreports" xmlns:xsi="http://www.w3.org/2001/XMLSchema-instance" xsi:schemaLocation="http://jasperreports.sourceforge.net/jasperreports http://jasperreports.sourceforge.net/xsd/jasperreport.xsd" name="pieChart" pageWidth="595" pageHeight="842" columnWidth="555" leftMargin="20" rightMargin="20" topMargin="20" bottomMargin="20" uuid="9c2bb08a-3188-44e0-b308-9db8c18be066">
<property name="com.jaspersoft.studio.data.defaultdataadapter" value="foodmart"/>
<property name="com.jaspersoft.studio.data.sql.tables" value=""/>
<property name="com.jaspersoft.studio.data.sql.SQLQueryDesigner.sash.w1" value="306"/>
<property name="com.jaspersoft.studio.data.sql.SQLQueryDesigner.sash.w2" value="687"/>
<property name="com.jaspersoft.studio.property.dataset.dialog.DatasetDialog.sash.w1" value="361"/>
<property name="com.jaspersoft.studio.property.dataset.dialog.DatasetDialog.sash.w2" value="625"/>
<property name="ireport.jasperserver.url" value="http://localhost:8080/jasperserver-pro/"/>
<property name="ireport.jasperserver.user" value="superuser"/>
<property name="ireport.jasperserver.report.resource" value="/public/HTML_5_Advanced_2018_19/Pie/9_Pie_Chart_As_3D_Pie_files/main_jrxml"/>
<property name="ireport.jasperserver.reportUnit" value="/public/HTML_5_Advanced_2018_19/Pie/9_Pie_Chart_As_3D_Pie"/>
<queryString>
<![CDATA[sELECT
occupation,
SUM(num_cars_owned) cars
FROM customer
GROUP BY occupation
ORDER BY occupation]]>
</queryString>
<field name="occupation" class="java.lang.String">
<property name="com.jaspersoft.studio.field.label" value="occupation"/>
<property name="com.jaspersoft.studio.field.tree.path" value="customer"/>
</field>
<field name="cars" class="java.lang.Long">
<property name="com.jaspersoft.studio.field.label" value="cars"/>
</field>
<background>
<band splitType="Stretch"/>
</background>
<summary>
<band height="344" splitType="Stretch">
<componentElement>
<reportElement x="0" y="0" width="555" height="344" uuid="bece7be7-9c73-45cb-89f1-ca2552ecdf19"/>
<hc:chart xmlns:hc="http://jaspersoft.com/highcharts" xsi:schemaLocation="http://jaspersoft.com/highcharts http://jaspersoft.com/schema/highcharts.xsd" type="Pie">
<hc:chartSetting name="default">
<hc:chartProperty name="title.text" value=""/>
<hc:chartProperty name="credits.enabled" value="false"/>
<hc:chartProperty name="credits.href" value=""/>
<hc:chartProperty name="credits.text" value=""/>
<hc:chartProperty name="yAxis.title.text" value=""/>
<hc:chartProperty name="chart.zoomType" value="xy"/>
<hc:chartProperty name="com.jaspersoft.studio.highcharts.dataconfiguration.simple" value="true"/>
<hc:chartProperty name="plotOptions.pie.showInLegend" value="true"/>
<hc:chartProperty name="chart.options3d.alpha_customSimpleMode" value="true"/>
<hc:chartProperty name="chart.options3d.alpha">
<hc:propertyExpression><![CDATA[45]]></hc:propertyExpression>
</hc:chartProperty>
<hc:chartProperty name="chart.options3d.enabled_customSimpleMode" value="true"/>
<hc:chartProperty name="chart.options3d.enabled">
<hc:propertyExpression><![CDATA[true]]></hc:propertyExpression>
</hc:chartProperty>
<hc:chartProperty name="plotOptions.pie.allowPointSelect_customSimpleMode" value="true"/>
<hc:chartProperty name="plotOptions.pie.allowPointSelect">
<hc:propertyExpression><![CDATA[true]]></hc:propertyExpression>
</hc:chartProperty>
<hc:chartProperty name="plotOptions.pie.cursor" value="pointer"/>
<hc:chartProperty name="plotOptions.pie.depth_customSimpleMode" value="true"/>
<hc:chartProperty name="plotOptions.pie.depth">
<hc:propertyExpression><![CDATA[35]]></hc:propertyExpression>
</hc:chartProperty>
<hc:chartProperty name="plotOptions.pie.dataLabels.format" value="{point.name}"/>
</hc:chartSetting>
<multiAxisData>
<multiAxisDataset/>
<dataAxis axis="Rows">
<axisLevel name="Level1">
<labelExpression><![CDATA["Level Label expression"]]></labelExpression>
<axisLevelBucket class="java.lang.Comparable">
<bucketExpression><![CDATA[$F{occupation}]]></bucketExpression>
</axisLevelBucket>
</axisLevel>
</dataAxis>
<multiAxisMeasure name="Measure1" class="java.lang.Number" calculation="Nothing">
<labelExpression><![CDATA["Cars"]]></labelExpression>
<valueExpression><![CDATA[$F{cars}]]></valueExpression>
</multiAxisMeasure>
</multiAxisData>
</hc:chart>
</componentElement>
</band>
</summary>
</jasperReport>
Convert a basic HTML-5 pie chart to have HTML-5 3D look and feel by setting up below advanced properties for the graph.
API properties:
chart: {
type: 'pie',
options3d: {
enabled: true,
alpha: 45,
beta: 0
}
plotOptions: {
pie: {
allowPointSelect: true,
cursor: 'pointer',
depth: 35,
dataLabels: {
enabled: true,
format: '{point.name}'
}
}
How these are converted to pie chart advanced properties:
References:
https://www.highcharts.com/demo/3d-pie
https://jsfiddle.net/gh/get/library/pure/highcharts/highcharts/tree/master/samples/highcharts/demo/3d-pie/
JRXML (Supports in 7.2 pro or later)
<?xml version="1.0" encoding="UTF-8"?>
<!-- Created with Jaspersoft Studio version 7.2.0.final using JasperReports Library version 6.6.0 -->
<jasperReport xmlns="http://jasperreports.sourceforge.net/jasperreports" xmlns:xsi="http://www.w3.org/2001/XMLSchema-instance" xsi:schemaLocation="http://jasperreports.sourceforge.net/jasperreports http://jasperreports.sourceforge.net/xsd/jasperreport.xsd" name="pieChart" pageWidth="595" pageHeight="842" columnWidth="555" leftMargin="20" rightMargin="20" topMargin="20" bottomMargin="20" uuid="9c2bb08a-3188-44e0-b308-9db8c18be066">
<property name="com.jaspersoft.studio.data.defaultdataadapter" value="foodmart"/>
<property name="com.jaspersoft.studio.data.sql.tables" value=""/>
<property name="com.jaspersoft.studio.data.sql.SQLQueryDesigner.sash.w1" value="306"/>
<property name="com.jaspersoft.studio.data.sql.SQLQueryDesigner.sash.w2" value="687"/>
<property name="com.jaspersoft.studio.property.dataset.dialog.DatasetDialog.sash.w1" value="361"/>
<property name="com.jaspersoft.studio.property.dataset.dialog.DatasetDialog.sash.w2" value="625"/>
<property name="ireport.jasperserver.url" value="http://localhost:8080/jasperserver-pro/"/>
<property name="ireport.jasperserver.user" value="superuser"/>
<property name="ireport.jasperserver.report.resource" value="/public/HTML_5_Advanced_2018_19/Pie/9_Pie_Chart_As_3D_Pie_files/main_jrxml"/>
<property name="ireport.jasperserver.reportUnit" value="/public/HTML_5_Advanced_2018_19/Pie/9_Pie_Chart_As_3D_Pie"/>
<queryString>
<![CDATA[sELECT
occupation,
SUM(num_cars_owned) cars
FROM customer
GROUP BY occupation
ORDER BY occupation]]>
</queryString>
<field name="occupation" class="java.lang.String">
<property name="com.jaspersoft.studio.field.label" value="occupation"/>
<property name="com.jaspersoft.studio.field.tree.path" value="customer"/>
</field>
<field name="cars" class="java.lang.Long">
<property name="com.jaspersoft.studio.field.label" value="cars"/>
</field>
<background>
<band splitType="Stretch"/>
</background>
<summary>
<band height="344" splitType="Stretch">
<componentElement>
<reportElement x="0" y="0" width="555" height="344" uuid="bece7be7-9c73-45cb-89f1-ca2552ecdf19"/>
<hc:chart xmlns:hc="http://jaspersoft.com/highcharts" xsi:schemaLocation="http://jaspersoft.com/highcharts http://jaspersoft.com/schema/highcharts.xsd" type="Pie">
<hc:chartSetting name="default">
<hc:chartProperty name="title.text" value=""/>
<hc:chartProperty name="credits.enabled" value="false"/>
<hc:chartProperty name="credits.href" value=""/>
<hc:chartProperty name="credits.text" value=""/>
<hc:chartProperty name="yAxis.title.text" value=""/>
<hc:chartProperty name="chart.zoomType" value="xy"/>
<hc:chartProperty name="com.jaspersoft.studio.highcharts.dataconfiguration.simple" value="true"/>
<hc:chartProperty name="plotOptions.pie.showInLegend" value="true"/>
<hc:chartProperty name="chart.options3d.alpha_customSimpleMode" value="true"/>
<hc:chartProperty name="chart.options3d.alpha">
<hc:propertyExpression><![CDATA[45]]></hc:propertyExpression>
</hc:chartProperty>
<hc:chartProperty name="chart.options3d.enabled_customSimpleMode" value="true"/>
<hc:chartProperty name="chart.options3d.enabled">
<hc:propertyExpression><![CDATA[true]]></hc:propertyExpression>
</hc:chartProperty>
<hc:chartProperty name="plotOptions.pie.allowPointSelect_customSimpleMode" value="true"/>
<hc:chartProperty name="plotOptions.pie.allowPointSelect">
<hc:propertyExpression><![CDATA[true]]></hc:propertyExpression>
</hc:chartProperty>
<hc:chartProperty name="plotOptions.pie.cursor" value="pointer"/>
<hc:chartProperty name="plotOptions.pie.depth_customSimpleMode" value="true"/>
<hc:chartProperty name="plotOptions.pie.depth">
<hc:propertyExpression><![CDATA[35]]></hc:propertyExpression>
</hc:chartProperty>
<hc:chartProperty name="plotOptions.pie.dataLabels.format" value="{point.name}"/>
</hc:chartSetting>
<multiAxisData>
<multiAxisDataset/>
<dataAxis axis="Rows">
<axisLevel name="Level1">
<labelExpression><![CDATA["Level Label expression"]]></labelExpression>
<axisLevelBucket class="java.lang.Comparable">
<bucketExpression><![CDATA[$F{occupation}]]></bucketExpression>
</axisLevelBucket>
</axisLevel>
</dataAxis>
<multiAxisMeasure name="Measure1" class="java.lang.Number" calculation="Nothing">
<labelExpression><![CDATA["Cars"]]></labelExpression>
<valueExpression><![CDATA[$F{cars}]]></valueExpression>
</multiAxisMeasure>
</multiAxisData>
</hc:chart>
</componentElement>
</band>
</summary>
</jasperReport>
Recommended Comments
There are no comments to display.