
Hi,
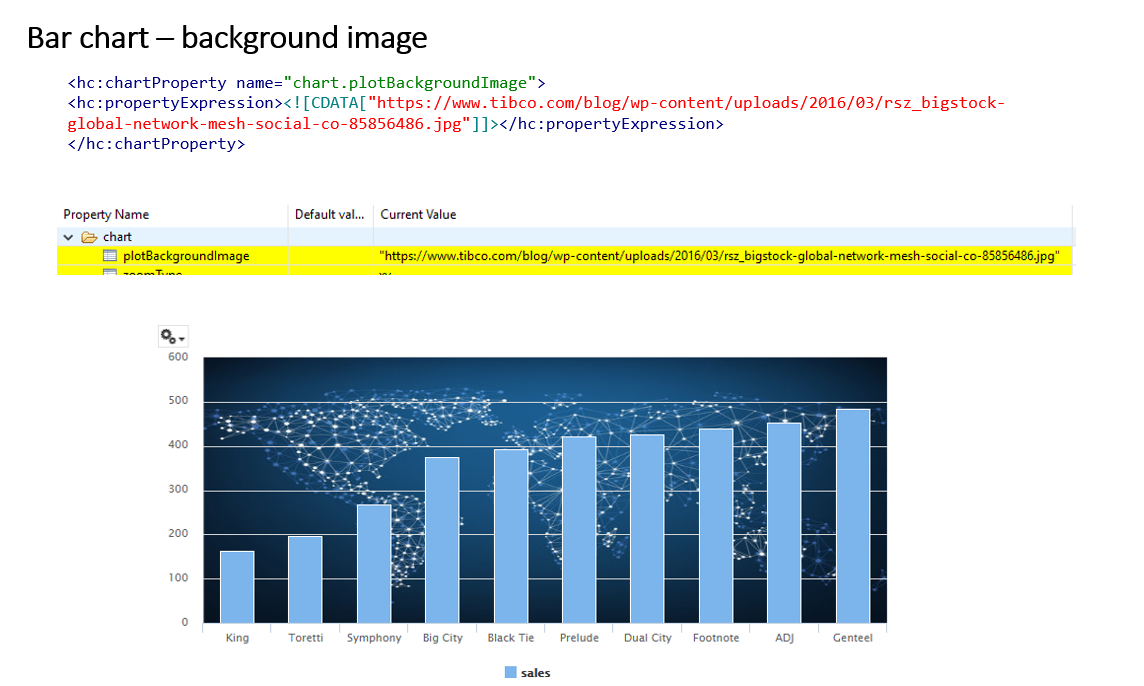
Set below property in chart Advanced properties to get the back-ground image for a column chart.
<hc:chartProperty name="chart.plotBackgroundImage">
<hc:propertyExpression><![CDATA["https://www.tibco.com/blog/wp-content/uploads/2016/03/rsz_bigstock-global-network-mesh-social-co-85856486.jpg"]]></hc:propertyExpression>
</hc:chartProperty>
JRXML(works from 7.2 pro or later)
<?xml version="1.0" encoding="UTF-8"?>
<!-- Created with Jaspersoft Studio version 7.2.0.final using JasperReports Library version 6.6.0 -->
<jasperReport xmlns="http://jasperreports.sourceforge.net/jasperreports" xmlns:xsi="http://www.w3.org/2001/XMLSchema-instance" xsi:schemaLocation="http://jasperreports.sourceforge.net/jasperreports http://jasperreports.sourceforge.net/xsd/jasperreport.xsd" name="1 Bar Chart" pageWidth="900" pageHeight="842" columnWidth="860" leftMargin="20" rightMargin="20" topMargin="20" bottomMargin="20" uuid="e3eaa82e-0ebf-4040-9ffa-69e6d8f80d09">
<property name="com.jaspersoft.studio.data.defaultdataadapter" value="foodmart"/>
<property name="com.jaspersoft.studio.data.sql.tables" value=""/>
<property name="ireport.jasperserver.url" value="http://localhost:8080/jasperserver-pro/"/>
<property name="ireport.jasperserver.user" value="superuser"/>
<property name="ireport.jasperserver.report.resource" value="/public/HTML_5_Advanced_2018_19/Bar/3_Bar_Chart_Background_image_files/main_jrxml"/>
<property name="ireport.jasperserver.reportUnit" value="/public/HTML_5_Advanced_2018_19/Bar/3_Bar_Chart_Background_image"/>
<queryString>
<![CDATA[sELECT
p.brand_name,
SUM(sf7.store_sales) store_sales
FROM product p
INNER JOIN sales_fact_1997 sf7
ON p.product_id=sf7.product_id
GROUP BY p.brand_name
ORDER BY
SUM(sf7.store_sales)
limit 10]]>
</queryString>
<field name="brand_name" class="java.lang.String">
<property name="com.jaspersoft.studio.field.label" value="brand_name"/>
<property name="com.jaspersoft.studio.field.tree.path" value="product"/>
</field>
<field name="store_sales" class="java.math.BigDecimal">
<property name="com.jaspersoft.studio.field.label" value="store_sales"/>
</field>
<background>
<band splitType="Stretch"/>
</background>
<summary>
<band height="416" splitType="Stretch">
<componentElement>
<reportElement x="0" y="30" width="750" height="360" uuid="214b17e1-736c-4964-904a-3eb532865e08">
<property name="com.jaspersoft.studio.unit.height" value="px"/>
</reportElement>
<hc:chart xmlns:hc="http://jaspersoft.com/highcharts" xsi:schemaLocation="http://jaspersoft.com/highcharts http://jaspersoft.com/schema/highcharts.xsd" type="Column">
<hc:chartSetting name="default">
<hc:chartProperty name="title.text" value=""/>
<hc:chartProperty name="credits.enabled" value="false"/>
<hc:chartProperty name="credits.href" value=""/>
<hc:chartProperty name="credits.text" value=""/>
<hc:chartProperty name="yAxis.title.text" value=""/>
<hc:chartProperty name="chart.zoomType" value="xy"/>
<hc:chartProperty name="chart.options3d.enabled_customSimpleMode" value="true"/>
<hc:chartProperty name="chart.options3d.alpha_customSimpleMode" value="true"/>
<hc:chartProperty name="chart.options3d.beta_customSimpleMode" value="true"/>
<hc:chartProperty name="chart.options3d.depth_customSimpleMode" value="true"/>
<hc:chartProperty name="chart.options3d.viewDistance_customSimpleMode" value="true"/>
<hc:chartProperty name="chart.borderWidth_customSimpleMode" value="true"/>
<hc:chartProperty name="chart.borderRadius_customSimpleMode" value="true"/>
<hc:chartProperty name="chart.plotBackgroundImage">
<hc:propertyExpression><![CDATA["https://www.tibco.com/blog/wp-content/uploads/2016/03/rsz_bigstock-global-network-mesh-social-co-85856486.jpg"]]></hc:propertyExpression>
</hc:chartProperty>
</hc:chartSetting>
<multiAxisData>
<multiAxisDataset/>
<dataAxis axis="Rows">
<axisLevel name="Level1">
<labelExpression><![CDATA["Level Label expression"]]></labelExpression>
<axisLevelBucket order="None" class="java.lang.Comparable">
<bucketExpression><![CDATA[$F{brand_name}]]></bucketExpression>
</axisLevelBucket>
</axisLevel>
</dataAxis>
<dataAxis axis="Columns"/>
<multiAxisMeasure name="Measure1" class="java.lang.Number" calculation="Nothing">
<labelExpression><![CDATA["sales"]]></labelExpression>
<valueExpression><![CDATA[$F{store_sales}]]></valueExpression>
</multiAxisMeasure>
</multiAxisData>
<hc:series name="Measure1"/>
</hc:chart>
</componentElement>
</band>
</summary>
</jasperReport>
Recommended Comments
There are no comments to display.