
Hi folks,
Here is the small workout. Hope you may find it useful.
Requirement is subjected to this post. :-)
Steps :
1) Right click on the bar chart ( Column vertical bar chart).
2) Click on "Show Advanced Properties"
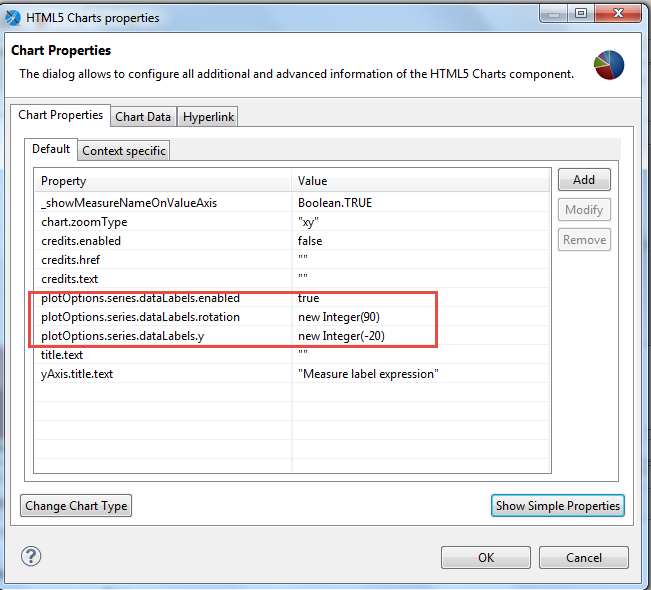
3) Click on "Add" button to add below 3 properties.
plotOptions.series.dataLabels.enabled = true
NOTE :
# no double quotes for true & check tick mark of Use an expression
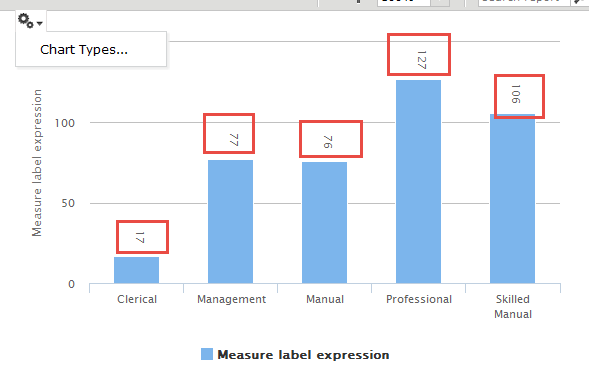
# This property enables the data values to show on bar(values would be outside of bar).
plotOptions.series.dataLabels.rotation= new Integer(90)
NOTE:
# check the tick mark of Use an expression
# This property rotates the data values vertically on bar.
plotOptions.series.dataLabels.y= new Integer(-20)
NOTE:
# check the tick mark of Use an expression
# This property is used to give the distance to the value vertically from the bar top.
Sample output :
How to in JRXML ?
JRXML Code :
(It works on foodmart database of Jasper postgresql & works with professional jasper studio only).
<?xml version="1.0" encoding="UTF-8"?>
<!-- Created with Jaspersoft Studio version 6.0.1.final using JasperReports Library version 6.0.0 -->
<!-- 2015-12-07T20:52:05 -->
<jasperReport xmlns="http://jasperreports.sourceforge.net/jasperreports" xmlns:xsi="http://www.w3.org/2001/XMLSchema-instance" xsi:schemaLocation="http://jasperreports.sourceforge.net/jasperreports http://jasperreports.sourceforge.net/xsd/jasperreport.xsd" name="Blank_A4" pageWidth="595" pageHeight="842" columnWidth="555" leftMargin="20" rightMargin="20" topMargin="20" bottomMargin="20" uuid="82e08b7f-0e4f-4aae-8514-6cdd45c368bf">
<property name="com.jaspersoft.studio.data.defaultdataadapter" value="foodmart - postgres"/>
<property name="ireport.jasperserver.url" value="http://localhost:8080/jasperserver-pro/"/>
<property name="ireport.jasperserver.user" value="superuser"/>
<property name="ireport.jasperserver.report.resource" value="/Explore/HTML5BarChart2_files/main_jrxml"/>
<property name="ireport.jasperserver.reportUnit" value="/Explore/HTML5BarChart2"/>
<queryString language="SQL">
<![CDATA[sELECT occupation,state_province, SUM(num_cars_owned) cars FROM customer c GROUP BY occupation ,state_province ORDER BY occupation ,state_province ]]>
</queryString>
<field name="occupation" class="java.lang.String"/>
<field name="state_province" class="java.lang.String"/>
<field name="cars" class="java.lang.Long"/>
<background>
<band splitType="Stretch"/>
</background>
<summary>
<band height="343" splitType="Stretch">
<componentElement>
<reportElement x="0" y="0" width="555" height="343" uuid="a5884ec2-1cf0-447b-b1dc-ba58f5056eba"/>
<hc:chart xmlns:hc="http://jaspersoft.com/highcharts" xsi:schemaLocation="http://jaspersoft.com/highcharts http://jaspersoft.com/schema/highcharts.xsd" type="Column">
<hc:chartSetting name="default">
<hc:chartProperty name="_showMeasureNameOnValueAxis">
<hc:propertyExpression><![CDATA[boolean.TRUE]]></hc:propertyExpression>
</hc:chartProperty>
<hc:chartProperty name="chart.zoomType">
<hc:propertyExpression><![CDATA["xy"]]></hc:propertyExpression>
</hc:chartProperty>
<hc:chartProperty name="credits.enabled">
<hc:propertyExpression><![CDATA[false]]></hc:propertyExpression>
</hc:chartProperty>
<hc:chartProperty name="credits.href">
<hc:propertyExpression><![CDATA[""]]></hc:propertyExpression>
</hc:chartProperty>
<hc:chartProperty name="credits.text">
<hc:propertyExpression><![CDATA[""]]></hc:propertyExpression>
</hc:chartProperty>
<hc:chartProperty name="plotOptions.series.dataLabels.enabled">
<hc:propertyExpression><![CDATA[true]]></hc:propertyExpression>
</hc:chartProperty>
<hc:chartProperty name="plotOptions.series.dataLabels.rotation">
<hc:propertyExpression><![CDATA[new Integer(90)]]></hc:propertyExpression>
</hc:chartProperty>
<hc:chartProperty name="plotOptions.series.dataLabels.y">
<hc:propertyExpression><![CDATA[new Integer(-20)]]></hc:propertyExpression>
</hc:chartProperty>
<hc:chartProperty name="title.text">
<hc:propertyExpression><![CDATA[""]]></hc:propertyExpression>
</hc:chartProperty>
<hc:chartProperty name="yAxis.title.text">
<hc:propertyExpression><![CDATA["Measure label expression"]]></hc:propertyExpression>
</hc:chartProperty>
</hc:chartSetting>
<multiAxisData>
<multiAxisDataset/>
<dataAxis axis="Rows">
<axisLevel name="Level1">
<labelExpression><![CDATA["Level Label expression"]]></labelExpression>
<axisLevelBucket class="java.lang.String">
<bucketExpression><![CDATA[$F{occupation}]]></bucketExpression>
</axisLevelBucket>
</axisLevel>
</dataAxis>
<dataAxis axis="Columns"/>
<multiAxisMeasure name="Measure1" class="java.lang.Integer" calculation="Nothing">
<labelExpression><![CDATA["Measure label expression"]]></labelExpression>
<valueExpression><![CDATA[$F{cars}]]></valueExpression>
</multiAxisMeasure>
</multiAxisData>
<hc:series name="Measure1"/>
</hc:chart>
</componentElement>
</band>
</summary>
</jasperReport>
References :
1) http://api.highcharts.com/highcharts#plotOptions.series.dataLabels
2) http://jsfiddle.net/gh/get/jquery/1.7.2/highslide-software/highcharts.com/tree/master/samples/highcharts/plotoptions/series-datalabels-align-left/
3) http://jsfiddle.net/gh/get/jquery/1.7.2/highslide-software/highcharts.com/tree/master/samples/highcharts/plotoptions/series-datalabels-rotation/
4) http://community.jaspersoft.com/wiki/advanced-formatting-new-html5-charts
Here is the small workout. Hope you may find it useful.
Requirement is subjected to this post. :-)
Steps :
1) Right click on the bar chart ( Column vertical bar chart).
2) Click on "Show Advanced Properties"
3) Click on "Add" button to add below 3 properties.
plotOptions.series.dataLabels.enabled = true
NOTE :
# no double quotes for true & check tick mark of Use an expression
# This property enables the data values to show on bar(values would be outside of bar).
plotOptions.series.dataLabels.rotation= new Integer(90)
NOTE:
# check the tick mark of Use an expression
# This property rotates the data values vertically on bar.
plotOptions.series.dataLabels.y= new Integer(-20)
NOTE:
# check the tick mark of Use an expression
# This property is used to give the distance to the value vertically from the bar top.
Sample output :
How to in JRXML ?
JRXML Code :
(It works on foodmart database of Jasper postgresql & works with professional jasper studio only).
<?xml version="1.0" encoding="UTF-8"?>
<!-- Created with Jaspersoft Studio version 6.0.1.final using JasperReports Library version 6.0.0 -->
<!-- 2015-12-07T20:52:05 -->
<jasperReport xmlns="http://jasperreports.sourceforge.net/jasperreports" xmlns:xsi="http://www.w3.org/2001/XMLSchema-instance" xsi:schemaLocation="http://jasperreports.sourceforge.net/jasperreports http://jasperreports.sourceforge.net/xsd/jasperreport.xsd" name="Blank_A4" pageWidth="595" pageHeight="842" columnWidth="555" leftMargin="20" rightMargin="20" topMargin="20" bottomMargin="20" uuid="82e08b7f-0e4f-4aae-8514-6cdd45c368bf">
<property name="com.jaspersoft.studio.data.defaultdataadapter" value="foodmart - postgres"/>
<property name="ireport.jasperserver.url" value="http://localhost:8080/jasperserver-pro/"/>
<property name="ireport.jasperserver.user" value="superuser"/>
<property name="ireport.jasperserver.report.resource" value="/Explore/HTML5BarChart2_files/main_jrxml"/>
<property name="ireport.jasperserver.reportUnit" value="/Explore/HTML5BarChart2"/>
<queryString language="SQL">
<![CDATA[sELECT occupation,state_province, SUM(num_cars_owned) cars FROM customer c GROUP BY occupation ,state_province ORDER BY occupation ,state_province ]]>
</queryString>
<field name="occupation" class="java.lang.String"/>
<field name="state_province" class="java.lang.String"/>
<field name="cars" class="java.lang.Long"/>
<background>
<band splitType="Stretch"/>
</background>
<summary>
<band height="343" splitType="Stretch">
<componentElement>
<reportElement x="0" y="0" width="555" height="343" uuid="a5884ec2-1cf0-447b-b1dc-ba58f5056eba"/>
<hc:chart xmlns:hc="http://jaspersoft.com/highcharts" xsi:schemaLocation="http://jaspersoft.com/highcharts http://jaspersoft.com/schema/highcharts.xsd" type="Column">
<hc:chartSetting name="default">
<hc:chartProperty name="_showMeasureNameOnValueAxis">
<hc:propertyExpression><![CDATA[boolean.TRUE]]></hc:propertyExpression>
</hc:chartProperty>
<hc:chartProperty name="chart.zoomType">
<hc:propertyExpression><![CDATA["xy"]]></hc:propertyExpression>
</hc:chartProperty>
<hc:chartProperty name="credits.enabled">
<hc:propertyExpression><![CDATA[false]]></hc:propertyExpression>
</hc:chartProperty>
<hc:chartProperty name="credits.href">
<hc:propertyExpression><![CDATA[""]]></hc:propertyExpression>
</hc:chartProperty>
<hc:chartProperty name="credits.text">
<hc:propertyExpression><![CDATA[""]]></hc:propertyExpression>
</hc:chartProperty>
<hc:chartProperty name="plotOptions.series.dataLabels.enabled">
<hc:propertyExpression><![CDATA[true]]></hc:propertyExpression>
</hc:chartProperty>
<hc:chartProperty name="plotOptions.series.dataLabels.rotation">
<hc:propertyExpression><![CDATA[new Integer(90)]]></hc:propertyExpression>
</hc:chartProperty>
<hc:chartProperty name="plotOptions.series.dataLabels.y">
<hc:propertyExpression><![CDATA[new Integer(-20)]]></hc:propertyExpression>
</hc:chartProperty>
<hc:chartProperty name="title.text">
<hc:propertyExpression><![CDATA[""]]></hc:propertyExpression>
</hc:chartProperty>
<hc:chartProperty name="yAxis.title.text">
<hc:propertyExpression><![CDATA["Measure label expression"]]></hc:propertyExpression>
</hc:chartProperty>
</hc:chartSetting>
<multiAxisData>
<multiAxisDataset/>
<dataAxis axis="Rows">
<axisLevel name="Level1">
<labelExpression><![CDATA["Level Label expression"]]></labelExpression>
<axisLevelBucket class="java.lang.String">
<bucketExpression><![CDATA[$F{occupation}]]></bucketExpression>
</axisLevelBucket>
</axisLevel>
</dataAxis>
<dataAxis axis="Columns"/>
<multiAxisMeasure name="Measure1" class="java.lang.Integer" calculation="Nothing">
<labelExpression><![CDATA["Measure label expression"]]></labelExpression>
<valueExpression><![CDATA[$F{cars}]]></valueExpression>
</multiAxisMeasure>
</multiAxisData>
<hc:series name="Measure1"/>
</hc:chart>
</componentElement>
</band>
</summary>
</jasperReport>
References :
1) http://api.highcharts.com/highcharts#plotOptions.series.dataLabels
2) http://jsfiddle.net/gh/get/jquery/1.7.2/highslide-software/highcharts.com/tree/master/samples/highcharts/plotoptions/series-datalabels-align-left/
3) http://jsfiddle.net/gh/get/jquery/1.7.2/highslide-software/highcharts.com/tree/master/samples/highcharts/plotoptions/series-datalabels-rotation/
4) http://community.jaspersoft.com/wiki/advanced-formatting-new-html5-charts
Recommended Comments
There are no comments to display.