
Hi Folks,
This post will give you the tip of setting Advanced properties to display the Category Axis (X-axis), Value Axis(Y-axis) in HighCharts of Jasper Design Studio.
Software Used for this example :
1) Jasper Design Studio 6.2 Professional
2) Jasper Server 6.2 Professional
3) Foodmart database of PostgreSQL .
1) Click on Advanced properties of Chart and Click on Add to add below shown properties.
2) Properties :
xAxis.lineColor = #008000 (check box disabled)
xAxis.lineWidth = new Integer(2) (check box enabled)
yAxis.lineColor = #FF0000 (check box disabled)
yAxis.line.Width= new Integer(1) (check box enabled)
3) Sample output in Server:
Reference :
http://jsfiddle.net/gh/get/jquery/1.7.2/highslide-software/highcharts.com/tree/master/samples/highcharts/yaxis/linecolor/
JRXML
<?xml version="1.0" encoding="UTF-8"?>
<!-- Created with Jaspersoft Studio version 6.2.0.final using JasperReports Library version 6.2.0 -->
<!-- 2016-01-27T13:59:59 -->
<jasperReport xmlns="http://jasperreports.sourceforge.net/jasperreports" xmlns:xsi="http://www.w3.org/2001/XMLSchema-instance" xsi:schemaLocation="http://jasperreports.sourceforge.net/jasperreports http://jasperreports.sourceforge.net/xsd/jasperreport.xsd" name="Statcked Bar With LIne" pageWidth="800" pageHeight="842" columnWidth="760" leftMargin="20" rightMargin="20" topMargin="20" bottomMargin="20" uuid="5d0254fd-0a3b-4d5d-8e26-3c4b6c618d0f">
<property name="com.jaspersoft.studio.data.defaultdataadapter" value="foodmart"/>
<property name="com.jaspersoft.studio.data.sql.tables" value=""/>
<property name="ireport.jasperserver.url" value="http://localhost:8081/jasperserver-pro/"/>
<property name="ireport.jasperserver.user" value="superuser"/>
<property name="ireport.jasperserver.report.resource" value="/Explore/Reports/Bar_Chart_X_axis_and_Y_axis_Line_Color_files/main_jrxml"/>
<property name="ireport.jasperserver.reportUnit" value="/Explore/Reports/Bar_Chart_X_axis_and_Y_axis_Line_Color"/>
<property name="com.jaspersoft.studio.unit." value="pixel"/>
<queryString>
<![CDATA[sELECT occupation,member_card,SUM(num_cars_owned) cars,SUM(total_children) children
FROM customer GROUP BY occupation ,member_card
order by occupation ,member_card]]>
</queryString>
<field name="occupation" class="java.lang.String"/>
<field name="member_card" class="java.lang.String"/>
<field name="cars" class="java.lang.Long"/>
<field name="children" class="java.lang.Long"/>
<background>
<band splitType="Stretch"/>
</background>
<summary>
<band height="350" splitType="Stretch">
<property name="com.jaspersoft.studio.unit.height" value="pixel"/>
<componentElement>
<reportElement x="0" y="0" width="760" height="350" uuid="fb580735-8c78-4008-93aa-2bd2bc6ed227"/>
<hc:chart xmlns:hc="http://jaspersoft.com/highcharts" xsi:schemaLocation="http://jaspersoft.com/highcharts http://jaspersoft.com/schema/highcharts.xsd" type="Column">
<hc:chartSetting name="default">
<hc:chartProperty name="chart.zoomType">
<hc:propertyExpression><![CDATA["xy"]]></hc:propertyExpression>
</hc:chartProperty>
<hc:chartProperty name="colors">
<hc:propertyExpression><![CDATA[java.util.Arrays.asList("#7cb5ec","#434348","#90ed7d","#f7a35c","#008000","#f15c80","#e4d354","#2b908f","#f45b5b","#91e8e1")]]></hc:propertyExpression>
</hc:chartProperty>
<hc:chartProperty name="credits.enabled">
<hc:propertyExpression><![CDATA[false]]></hc:propertyExpression>
</hc:chartProperty>
<hc:chartProperty name="credits.href">
<hc:propertyExpression><![CDATA[""]]></hc:propertyExpression>
</hc:chartProperty>
<hc:chartProperty name="credits.text">
<hc:propertyExpression><![CDATA[""]]></hc:propertyExpression>
</hc:chartProperty>
<hc:chartProperty name="title.text">
<hc:propertyExpression><![CDATA[""]]></hc:propertyExpression>
</hc:chartProperty>
<hc:chartProperty name="xAxis.lineColor" value="#008000"/>
<hc:chartProperty name="xAxis.lineWidth">
<hc:propertyExpression><![CDATA[new Integer(2)]]></hc:propertyExpression>
</hc:chartProperty>
<hc:chartProperty name="yAxis.lineColor" value="#FF0000"/>
<hc:chartProperty name="yAxis.lineWidth">
<hc:propertyExpression><![CDATA[new Integer(2)]]></hc:propertyExpression>
</hc:chartProperty>
<hc:chartProperty name="yAxis.title.text">
<hc:propertyExpression><![CDATA["Number Of Cars"]]></hc:propertyExpression>
</hc:chartProperty>
</hc:chartSetting>
<multiAxisData>
<multiAxisDataset/>
<dataAxis axis="Rows">
<axisLevel name="Level1">
<labelExpression><![CDATA["Level Label expression"]]></labelExpression>
<axisLevelBucket class="java.lang.String">
<bucketExpression><![CDATA[$F{occupation}]]></bucketExpression>
</axisLevelBucket>
</axisLevel>
</dataAxis>
<dataAxis axis="Columns"/>
<multiAxisMeasure name="Measure1" class="java.lang.Integer" calculation="Sum">
<labelExpression><![CDATA["Number Of Cars : "]]></labelExpression>
<valueExpression><![CDATA[$F{cars}]]></valueExpression>
</multiAxisMeasure>
</multiAxisData>
<hc:series name="Measure1"/>
</hc:chart>
</componentElement>
</band>
</summary>
</jasperReport>
This post will give you the tip of setting Advanced properties to display the Category Axis (X-axis), Value Axis(Y-axis) in HighCharts of Jasper Design Studio.
Software Used for this example :
1) Jasper Design Studio 6.2 Professional
2) Jasper Server 6.2 Professional
3) Foodmart database of PostgreSQL .
1) Click on Advanced properties of Chart and Click on Add to add below shown properties.
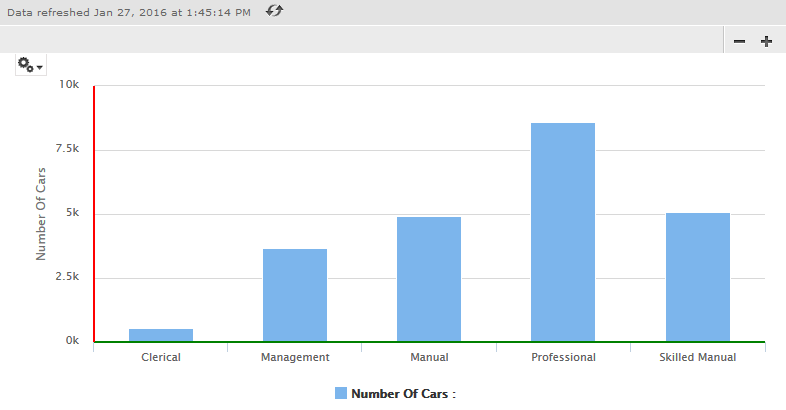
2) Properties :
xAxis.lineColor = #008000 (check box disabled)
xAxis.lineWidth = new Integer(2) (check box enabled)
yAxis.lineColor = #FF0000 (check box disabled)
yAxis.line.Width= new Integer(1) (check box enabled)
3) Sample output in Server:
Reference :
http://jsfiddle.net/gh/get/jquery/1.7.2/highslide-software/highcharts.com/tree/master/samples/highcharts/yaxis/linecolor/
JRXML
<?xml version="1.0" encoding="UTF-8"?>
<!-- Created with Jaspersoft Studio version 6.2.0.final using JasperReports Library version 6.2.0 -->
<!-- 2016-01-27T13:59:59 -->
<jasperReport xmlns="http://jasperreports.sourceforge.net/jasperreports" xmlns:xsi="http://www.w3.org/2001/XMLSchema-instance" xsi:schemaLocation="http://jasperreports.sourceforge.net/jasperreports http://jasperreports.sourceforge.net/xsd/jasperreport.xsd" name="Statcked Bar With LIne" pageWidth="800" pageHeight="842" columnWidth="760" leftMargin="20" rightMargin="20" topMargin="20" bottomMargin="20" uuid="5d0254fd-0a3b-4d5d-8e26-3c4b6c618d0f">
<property name="com.jaspersoft.studio.data.defaultdataadapter" value="foodmart"/>
<property name="com.jaspersoft.studio.data.sql.tables" value=""/>
<property name="ireport.jasperserver.url" value="http://localhost:8081/jasperserver-pro/"/>
<property name="ireport.jasperserver.user" value="superuser"/>
<property name="ireport.jasperserver.report.resource" value="/Explore/Reports/Bar_Chart_X_axis_and_Y_axis_Line_Color_files/main_jrxml"/>
<property name="ireport.jasperserver.reportUnit" value="/Explore/Reports/Bar_Chart_X_axis_and_Y_axis_Line_Color"/>
<property name="com.jaspersoft.studio.unit." value="pixel"/>
<queryString>
<![CDATA[sELECT occupation,member_card,SUM(num_cars_owned) cars,SUM(total_children) children
FROM customer GROUP BY occupation ,member_card
order by occupation ,member_card]]>
</queryString>
<field name="occupation" class="java.lang.String"/>
<field name="member_card" class="java.lang.String"/>
<field name="cars" class="java.lang.Long"/>
<field name="children" class="java.lang.Long"/>
<background>
<band splitType="Stretch"/>
</background>
<summary>
<band height="350" splitType="Stretch">
<property name="com.jaspersoft.studio.unit.height" value="pixel"/>
<componentElement>
<reportElement x="0" y="0" width="760" height="350" uuid="fb580735-8c78-4008-93aa-2bd2bc6ed227"/>
<hc:chart xmlns:hc="http://jaspersoft.com/highcharts" xsi:schemaLocation="http://jaspersoft.com/highcharts http://jaspersoft.com/schema/highcharts.xsd" type="Column">
<hc:chartSetting name="default">
<hc:chartProperty name="chart.zoomType">
<hc:propertyExpression><![CDATA["xy"]]></hc:propertyExpression>
</hc:chartProperty>
<hc:chartProperty name="colors">
<hc:propertyExpression><![CDATA[java.util.Arrays.asList("#7cb5ec","#434348","#90ed7d","#f7a35c","#008000","#f15c80","#e4d354","#2b908f","#f45b5b","#91e8e1")]]></hc:propertyExpression>
</hc:chartProperty>
<hc:chartProperty name="credits.enabled">
<hc:propertyExpression><![CDATA[false]]></hc:propertyExpression>
</hc:chartProperty>
<hc:chartProperty name="credits.href">
<hc:propertyExpression><![CDATA[""]]></hc:propertyExpression>
</hc:chartProperty>
<hc:chartProperty name="credits.text">
<hc:propertyExpression><![CDATA[""]]></hc:propertyExpression>
</hc:chartProperty>
<hc:chartProperty name="title.text">
<hc:propertyExpression><![CDATA[""]]></hc:propertyExpression>
</hc:chartProperty>
<hc:chartProperty name="xAxis.lineColor" value="#008000"/>
<hc:chartProperty name="xAxis.lineWidth">
<hc:propertyExpression><![CDATA[new Integer(2)]]></hc:propertyExpression>
</hc:chartProperty>
<hc:chartProperty name="yAxis.lineColor" value="#FF0000"/>
<hc:chartProperty name="yAxis.lineWidth">
<hc:propertyExpression><![CDATA[new Integer(2)]]></hc:propertyExpression>
</hc:chartProperty>
<hc:chartProperty name="yAxis.title.text">
<hc:propertyExpression><![CDATA["Number Of Cars"]]></hc:propertyExpression>
</hc:chartProperty>
</hc:chartSetting>
<multiAxisData>
<multiAxisDataset/>
<dataAxis axis="Rows">
<axisLevel name="Level1">
<labelExpression><![CDATA["Level Label expression"]]></labelExpression>
<axisLevelBucket class="java.lang.String">
<bucketExpression><![CDATA[$F{occupation}]]></bucketExpression>
</axisLevelBucket>
</axisLevel>
</dataAxis>
<dataAxis axis="Columns"/>
<multiAxisMeasure name="Measure1" class="java.lang.Integer" calculation="Sum">
<labelExpression><![CDATA["Number Of Cars : "]]></labelExpression>
<valueExpression><![CDATA[$F{cars}]]></valueExpression>
</multiAxisMeasure>
</multiAxisData>
<hc:series name="Measure1"/>
</hc:chart>
</componentElement>
</band>
</summary>
</jasperReport>
Recommended Comments
There are no comments to display.