
Hi Guys,
Jasper is going pretty with it's commercial features... First of all, I'd like to say thanks to the TIBCO Jasper Team for it's awesome new product(Visualize.js) for Embedding BI...
Apart from dashboard designing in internal Dashboard Editor of Jasper Server, now we can create dashboards in HTML pages using HTML5 + CSS + Java Script +Visualize.js and more.... Simply you can call these HTML pages in your 3rd party application..
In my previous tutorial Click this I have discussed about the trail of Embedding BI using Visualize.js + HTML+CSS on online JSFIDDLE editor (Which is taken from jasper video tutorials).
In this post, I'd like to share my 1st experience in designing a responsive webpage using visualize.js for jasper reports...
As this is my 1st exploration, I've taken simple example and the reports on the webpage are static. I believe this post will give some idea on implementing visualize.js for Embedding BI to the beginners like me with jasper's new product.
I'm also thankful to the team members of web-designers who shared their knowledge in giving tips of HTML-5 and the panels for this particular example.
What you can learn in this post ?
1. Authenticating jasper server using visualize.js javascript.
2. Calling a report first then calling multiple Reports.
3. Write panel code for reports to render using HTML5+CSS.
4. How to call the designed webpage(let's say : dashboar.html) in 3rd party application (i.e., in the server - tomcat server ).
What are the future workouts on the same example? (Will post another write up once worked out )
1. Parameter Passing.
2. Hyperlinks , Drill downs ( Inter Chart drill down on the same page + Next web page drill down)
Benefits :
1) Responsiveness in all the devices ( Mobile, iPad, Laptop, Desktop). - As of now tested in Desktop but with browser re-sizing(like mobile width,iPad width).
2) Fast rendering of the reports compared with normal dashboard rendering. - 5.6 has improved performance in getting the report output.
I'm not going to discuss about reports development instead talking about pre-defined reports calling in web-page.
Software Ready :
1) Jasper Server 5.6 installed.
2) Your 3rd party web server (Tomcat Server(or any other) for application where you are going to deploy the web-page).
Knowledge Required : HTML-5+CSS+Java Script+Visualize.js+Jasper Reports+Jasper Server.
Steps to follow : This is a beginners guide... working on remaining things....
If you are an expert in HTML,CSS,JavaScript you can take individual files for them ...
This post will talk about mixture of all the code in a single file.
Step 1 : Creating a folder and HTML file
a) Create a folder (Example : test) and inside it create a file ( Example : dashboard1.html)
b) Open the file in Notepad++ in HTML mode.
Step 2 : Coding in HTML file
Write your HTML code - i.e., divide the web-page as panels for your charts .. In this example I've taken 3 divisions with the help of WEB-DESIGNERS... These web-page divisions should be responsive as shown in below images.
Image-1:
Image 2: Resize 2 of web page
Image-3:Resize 3 of web page
The plain HTML-5 code for responsive webpage is given below for the above images. . Take help of your web-designer..
Step-3:
Calling jasper server using visualize.js code - write visualize.js code in the above html file properly to authenticate the jasper server and the required reports..
I have taken simple report and called that report 3 times in 3 divisions with chart type changes as a demo purpose.. you can call your own created reports..
After writing the visualize.js code you HMML file code should looks like as below.
<!DOCTYPE HTML>
<html>
<head>
<meta charset="utf-8">
<title>Untitled Document</title>
<style type="text/css">
*{ margin:0; padding:0;}
*, *:before, *:after {
box-sizing: border-box;
}
.main {
width:100%;
margin-top:20px;
}
.column{
float: left;
width: 33.3333%;
padding:0 20px;
text-align:center;
}
.column div{ padding:20px 0px;}
.column_1 div{
/* background-color: #3F5E6F; */
border-color: #36505F;
color: #FFFFFF;
}
.column_2 div{
/* background-color: #006848; */
border-color: #004E36;
color: #FFFFFF;
}
.column_3 div{
/* background-color: #D76300; */
border-color: #BE5700;
color: #FFFFFF;
}
@media screen and (max-width:1000px)
{
.column{ width:100% !important; margin-bottom:10px}
}
</style>
</head>
<body>
<div class="main">
<div id="container" class="column column_1"><div>Why Jaspersoft</div></div>
<div id="container2" class="column column_2"><div>Register for the Demo</div></div>
<div id="container3" class="column column_3"><div>Quick-Start Guide</div></div>
</div>
<script type="text/javascript" src="http://localhost:8081/jasperserver-pro/client/visualize.js?_opt=false&logLevel=debug"></script>
<script type="text/javascript">
visualize(
{
auth: {
name: "jasperadmin",
password: "jasperadmin",
organization:"organization_1"
//timezone: "Europe/Helsinki"
}
},
function (v) {
//'v' it's a client to JRS instance initialized above
// with a session established for joeuser from organization_1
//alert("Welcome! JRS Authentication successful.");
v("#container").report({resource:"/public/Samples/Reports/01._Geographic_Results_by_Segment_Report" });
v("#container2").report({resource:"/public/Samples/Reports/01._Geographic_Results_by_Segment_Report" });
v("#container3").report({resource:"/public/Samples/Reports/01._Geographic_Results_by_Segment_Report" });
},
function (err) {
alert("Auth error! Server said: " + err.message);
});
</script>
</body>
</html>
Step-4:
Deploy the folder in tomcat webapps folder.
tomcat/webapps/test
(OR) keep the folder where ever you require in your web-application(i.e., in project folders).
Step -5:
Call the page in the browser URL .i.e., http://192.123.1.34:8080/test/dashboard.html
That's it .. you have done with the dashboard like web-page consists of jasper reports which is called Embedding BI using jasper reports...
Sample Images looks like below for the above example...
Image 1 : Laptop OR Desktop browser View
Download the example here : Click Me
Image 2 : Mobile View - Resize of browser - Not tested in Mobile (Hmmmmmm..... No smart phone yet)
IMP NOTE :
1. Always call the webpage in browser URL with host specific but not with the file path.
i.e.,
Correct : http://192.168.1.134:8080/test/dashboard.html
Incorrect: http://localhost:8080/test/dashboard.html (Specific to my case )
Incorrect : file:///C:/Users/sadakar/Desktop/test/dashboard.html (This works only for HTML but not for visualze.js scripting for the reports.
2. Use fiddle.net editor to separate the HTML,CSS and visualize.js code for testing purpose.
3. Google Chrome is preferable browser in my view (Of course, the example will work in all the popular web browsers like Mozilla, Safari).
Thank you for reading my little document & get back to me with your valuable suggestions on improving the example in comment box.. I hope this article will useful for some people who is starting with visulaize.js
BI DEVELOPER
(JasperSoft/Pentaho/Talend ETL)
Jasper is going pretty with it's commercial features... First of all, I'd like to say thanks to the TIBCO Jasper Team for it's awesome new product(Visualize.js) for Embedding BI...
Apart from dashboard designing in internal Dashboard Editor of Jasper Server, now we can create dashboards in HTML pages using HTML5 + CSS + Java Script +Visualize.js and more.... Simply you can call these HTML pages in your 3rd party application..
In my previous tutorial Click this I have discussed about the trail of Embedding BI using Visualize.js + HTML+CSS on online JSFIDDLE editor (Which is taken from jasper video tutorials).
In this post, I'd like to share my 1st experience in designing a responsive webpage using visualize.js for jasper reports...
As this is my 1st exploration, I've taken simple example and the reports on the webpage are static. I believe this post will give some idea on implementing visualize.js for Embedding BI to the beginners like me with jasper's new product.
I'm also thankful to the team members of web-designers who shared their knowledge in giving tips of HTML-5 and the panels for this particular example.
What you can learn in this post ?
1. Authenticating jasper server using visualize.js javascript.
2. Calling a report first then calling multiple Reports.
3. Write panel code for reports to render using HTML5+CSS.
4. How to call the designed webpage(let's say : dashboar.html) in 3rd party application (i.e., in the server - tomcat server ).
What are the future workouts on the same example? (Will post another write up once worked out )
1. Parameter Passing.
2. Hyperlinks , Drill downs ( Inter Chart drill down on the same page + Next web page drill down)
Benefits :
1) Responsiveness in all the devices ( Mobile, iPad, Laptop, Desktop). - As of now tested in Desktop but with browser re-sizing(like mobile width,iPad width).
2) Fast rendering of the reports compared with normal dashboard rendering. - 5.6 has improved performance in getting the report output.
I'm not going to discuss about reports development instead talking about pre-defined reports calling in web-page.
Software Ready :
1) Jasper Server 5.6 installed.
2) Your 3rd party web server (Tomcat Server(or any other) for application where you are going to deploy the web-page).
Knowledge Required : HTML-5+CSS+Java Script+Visualize.js+Jasper Reports+Jasper Server.
Steps to follow : This is a beginners guide... working on remaining things....
If you are an expert in HTML,CSS,JavaScript you can take individual files for them ...
This post will talk about mixture of all the code in a single file.
Step 1 : Creating a folder and HTML file
a) Create a folder (Example : test) and inside it create a file ( Example : dashboard1.html)
b) Open the file in Notepad++ in HTML mode.
Step 2 : Coding in HTML file
Write your HTML code - i.e., divide the web-page as panels for your charts .. In this example I've taken 3 divisions with the help of WEB-DESIGNERS... These web-page divisions should be responsive as shown in below images.
Image-1:
Image 2: Resize 2 of web page
Image-3:Resize 3 of web page
The plain HTML-5 code for responsive webpage is given below for the above images. . Take help of your web-designer..
| <!DOCTYPE HTML> | |
| <html> | |
| <head> | |
| <meta charset="utf-8"> | |
| <title>Untitled Document</title> | |
| <style type="text/css"> | |
| *{ margin:0; padding:0;} | |
| *, *:before, *:after { | |
| box-sizing: border-box; | |
| } | |
| .main { | |
| width:100%; | |
| margin-top:20px; | |
| } | |
| .column{ | |
| float: left; | |
| width: 33.3333%; | |
| padding:0 20px; | |
| text-align:center; | |
| } | |
| .column div{ padding:20px 0px;} | |
| .column_1 div{ | |
| background-color: #3F5E6F; | |
| border-color: #36505F; | |
| color: #FFFFFF; | |
| } | |
| .column_2 div{ | |
| background-color: #006848; | |
| border-color: #004E36; | |
| color: #FFFFFF; | |
| } | |
| .column_3 div{ | |
| background-color: #D76300; | |
| border-color: #BE5700; | |
| color: #FFFFFF; | |
| } | |
| @media screen and (max-width:1000px) | |
| { | |
| .column{ width:100% !important; margin-bottom:10px} | |
| } | |
| </style> | |
| </head> | |
| <body> | |
| <div class="main"> | |
| <div class="column column_1"><div>Report1</div></div> | |
| <div class="column column_2"><div>Report2</div></div> | |
| <div class="column column_3"><div>Report3</div></div> | |
| </div> | |
| </body> | |
| </html> | |
Calling jasper server using visualize.js code - write visualize.js code in the above html file properly to authenticate the jasper server and the required reports..
I have taken simple report and called that report 3 times in 3 divisions with chart type changes as a demo purpose.. you can call your own created reports..
After writing the visualize.js code you HMML file code should looks like as below.
<!DOCTYPE HTML>
<html>
<head>
<meta charset="utf-8">
<title>Untitled Document</title>
<style type="text/css">
*{ margin:0; padding:0;}
*, *:before, *:after {
box-sizing: border-box;
}
.main {
width:100%;
margin-top:20px;
}
.column{
float: left;
width: 33.3333%;
padding:0 20px;
text-align:center;
}
.column div{ padding:20px 0px;}
.column_1 div{
/* background-color: #3F5E6F; */
border-color: #36505F;
color: #FFFFFF;
}
.column_2 div{
/* background-color: #006848; */
border-color: #004E36;
color: #FFFFFF;
}
.column_3 div{
/* background-color: #D76300; */
border-color: #BE5700;
color: #FFFFFF;
}
@media screen and (max-width:1000px)
{
.column{ width:100% !important; margin-bottom:10px}
}
</style>
</head>
<body>
<div class="main">
<div id="container" class="column column_1"><div>Why Jaspersoft</div></div>
<div id="container2" class="column column_2"><div>Register for the Demo</div></div>
<div id="container3" class="column column_3"><div>Quick-Start Guide</div></div>
</div>
<script type="text/javascript" src="http://localhost:8081/jasperserver-pro/client/visualize.js?_opt=false&logLevel=debug"></script>
<script type="text/javascript">
visualize(
{
auth: {
name: "jasperadmin",
password: "jasperadmin",
organization:"organization_1"
//timezone: "Europe/Helsinki"
}
},
function (v) {
//'v' it's a client to JRS instance initialized above
// with a session established for joeuser from organization_1
//alert("Welcome! JRS Authentication successful.");
v("#container").report({resource:"/public/Samples/Reports/01._Geographic_Results_by_Segment_Report" });
v("#container2").report({resource:"/public/Samples/Reports/01._Geographic_Results_by_Segment_Report" });
v("#container3").report({resource:"/public/Samples/Reports/01._Geographic_Results_by_Segment_Report" });
},
function (err) {
alert("Auth error! Server said: " + err.message);
});
</script>
</body>
</html>
Step-4:
Deploy the folder in tomcat webapps folder.
tomcat/webapps/test
(OR) keep the folder where ever you require in your web-application(i.e., in project folders).
Step -5:
Call the page in the browser URL .i.e., http://192.123.1.34:8080/test/dashboard.html
That's it .. you have done with the dashboard like web-page consists of jasper reports which is called Embedding BI using jasper reports...
Sample Images looks like below for the above example...
Image 1 : Laptop OR Desktop browser View
Download the example here : Click Me
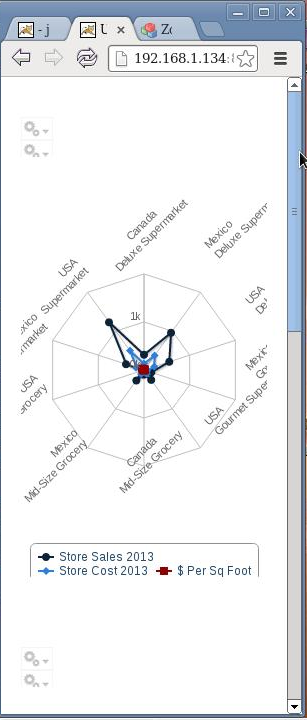
Image 2 : Mobile View - Resize of browser - Not tested in Mobile (Hmmmmmm..... No smart phone yet)
IMP NOTE :
1. Always call the webpage in browser URL with host specific but not with the file path.
i.e.,
Correct : http://192.168.1.134:8080/test/dashboard.html
Incorrect: http://localhost:8080/test/dashboard.html (Specific to my case )
Incorrect : file:///C:/Users/sadakar/Desktop/test/dashboard.html (This works only for HTML but not for visualze.js scripting for the reports.
2. Use fiddle.net editor to separate the HTML,CSS and visualize.js code for testing purpose.
3. Google Chrome is preferable browser in my view (Of course, the example will work in all the popular web browsers like Mozilla, Safari).
Thank you for reading my little document & get back to me with your valuable suggestions on improving the example in comment box.. I hope this article will useful for some people who is starting with visulaize.js
Go New With JasperSoft....!!!!
SADAKARBI DEVELOPER
(JasperSoft/Pentaho/Talend ETL)
Recommended Comments
There are no comments to display.