
Hi Folks,
This post will teach you how to work with 100% horizontal stacked highcharts bar chart in Jasper reports and how to work with Advanced properties of it.
I hope this would help some one in saving their(s) time.
Software used to test this example :
1) Jasper Design Studio 6.1
2) foodmart database of postgresql
3) Jasper Server 6.0.1 professional & Mozilla firefox web browser.
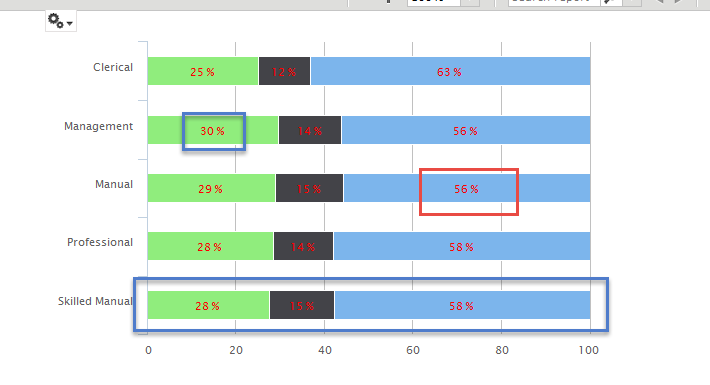
Sample output of the report :
I hope you have already knew how to create a new report hence skipping some basic steps and concentrating in explaining core parts.
1) Sample Query Design
SELECT
occupation,
state_province,
SUM(num_cars_owned) cars
FROM customer c
WHERE state_province IN('CA','WA','OR')
GROUP BY
occupation ,
state_province
ORDER BY
occupation,
state_province
2) Sample output of the query
3) Drag and drop "StackedPercBar" chart from HTML-5 charts component from Palette section.
4) Right click on it get the chart properties.
In chart data section & under configuration tab give below.
Category : $F{occupation} (of java.lang.String type)
Series : $F{state_province} (of java.lang.String type)
Measures : $F{cars} (of java.lang.Integer type)
5) Come back to the chart properties and click on Advanced Properties and click on "Add" button to add below properties.
plotOptions.series.dataLabels.enabled = ture
(Tick the check box) - to enable the values
plotOptions.series.dataLabels.format =" {point.percentage:.0f} % "
(tick the check box) - to get the %'s
plotOptions.series.dataLabels.color = #FF0000
(do not check the tick box) - to get the colors for values
See below image for accuracy
6) Save the report, publish it the server and have preview. Output should look as shown in first image to this post.
JRXML code : (copy paste the code to get the same copy in your JRXML source , note that it will only work in professional studio or iReport).
<?xml version="1.0" encoding="UTF-8"?>
<!-- Created with Jaspersoft Studio version 6.0.1.final using JasperReports Library version 6.0.0 -->
<!-- 2015-12-07T21:20:57 -->
<jasperReport xmlns="http://jasperreports.sourceforge.net/jasperreports" xmlns:xsi="http://www.w3.org/2001/XMLSchema-instance" xsi:schemaLocation="http://jasperreports.sourceforge.net/jasperreports http://jasperreports.sourceforge.net/xsd/jasperreport.xsd" name="Blank_A4_1" pageWidth="595" pageHeight="842" columnWidth="555" leftMargin="20" rightMargin="20" topMargin="20" bottomMargin="20" uuid="f8b9b5a2-390b-4136-94c7-00c39ec1a61d">
<property name="com.jaspersoft.studio.data.defaultdataadapter" value="foodmart"/>
<property name="ireport.jasperserver.url" value="http://localhost:8080/jasperserver-pro/"/>
<property name="ireport.jasperserver.user" value="superuser"/>
<property name="ireport.jasperserver.report.resource" value="/Explore/HTML5BarChart_files/main_jrxml"/>
<property name="ireport.jasperserver.reportUnit" value="/Explore/HTML5BarChart"/>
<queryString language="SQL">
<![CDATA[sELECT
occupation,
state_province,
SUM(num_cars_owned) cars
FROM customer c
WHERE state_province IN('CA','WA','OR')
GROUP BY
occupation ,
state_province
ORDER BY
occupation,
state_province
]]>
</queryString>
<field name="occupation" class="java.lang.String"/>
<field name="cars" class="java.lang.Long"/>
<field name="state_province" class="java.lang.String"/>
<background>
<band splitType="Stretch"/>
</background>
<summary>
<band height="340" splitType="Stretch">
<componentElement>
<reportElement x="0" y="0" width="555" height="340" uuid="b2a63a16-5851-438a-af78-98a11b27ddf3"/>
<hc:chart xmlns:hc="http://jaspersoft.com/highcharts" xsi:schemaLocation="http://jaspersoft.com/highcharts http://jaspersoft.com/schema/highcharts.xsd" type="StackedPercentBar">
<hc:chartSetting name="default">
<hc:chartProperty name="chart.zoomType">
<hc:propertyExpression><![CDATA["xy"]]></hc:propertyExpression>
</hc:chartProperty>
<hc:chartProperty name="credits.enabled">
<hc:propertyExpression><![CDATA[false]]></hc:propertyExpression>
</hc:chartProperty>
<hc:chartProperty name="credits.href">
<hc:propertyExpression><![CDATA[""]]></hc:propertyExpression>
</hc:chartProperty>
<hc:chartProperty name="credits.text">
<hc:propertyExpression><![CDATA[""]]></hc:propertyExpression>
</hc:chartProperty>
<hc:chartProperty name="legend.enabled">
<hc:propertyExpression><![CDATA[boolean.FALSE]]></hc:propertyExpression>
</hc:chartProperty>
<hc:chartProperty name="plotOptions.series.allowPointSelect">
<hc:propertyExpression><![CDATA[boolean.TRUE]]></hc:propertyExpression>
</hc:chartProperty>
<hc:chartProperty name="plotOptions.series.connectNulls">
<hc:propertyExpression><![CDATA[boolean.TRUE]]></hc:propertyExpression>
</hc:chartProperty>
<hc:chartProperty name="plotOptions.series.dataLabels.color" value="#FF0000"/>
<hc:chartProperty name="plotOptions.series.dataLabels.enabled">
<hc:propertyExpression><![CDATA[true]]></hc:propertyExpression>
</hc:chartProperty>
<hc:chartProperty name="plotOptions.series.dataLabels.format">
<hc:propertyExpression><![CDATA[" {point.percentage:.0f} % "]]></hc:propertyExpression>
</hc:chartProperty>
<hc:chartProperty name="plotOptions.series.selected">
<hc:propertyExpression><![CDATA[boolean.TRUE]]></hc:propertyExpression>
</hc:chartProperty>
<hc:chartProperty name="plotOptions.series.showCheckBox">
<hc:propertyExpression><![CDATA[boolean.TRUE]]></hc:propertyExpression>
</hc:chartProperty>
<hc:chartProperty name="title.text">
<hc:propertyExpression><![CDATA[""]]></hc:propertyExpression>
</hc:chartProperty>
<hc:chartProperty name="yAxis.title.text">
<hc:propertyExpression><![CDATA[""]]></hc:propertyExpression>
</hc:chartProperty>
</hc:chartSetting>
<multiAxisData>
<multiAxisDataset/>
<dataAxis axis="Rows">
<axisLevel name="Level1">
<labelExpression><![CDATA["Level Label expression"]]></labelExpression>
<axisLevelBucket class="java.lang.String">
<bucketExpression><![CDATA[$F{occupation}]]></bucketExpression>
</axisLevelBucket>
</axisLevel>
</dataAxis>
<dataAxis axis="Columns">
<axisLevel name="state_province">
<labelExpression><![CDATA[]]></labelExpression>
<axisLevelBucket order="None" class="java.lang.String">
<bucketExpression><![CDATA[$F{state_province}]]></bucketExpression>
</axisLevelBucket>
</axisLevel>
</dataAxis>
<multiAxisMeasure name="cars" class="java.lang.Integer" calculation="Nothing">
<labelExpression><![CDATA["Measure label expression"]]></labelExpression>
<valueExpression><![CDATA[$F{cars}]]></valueExpression>
</multiAxisMeasure>
</multiAxisData>
<hc:series name="cars"/>
</hc:chart>
</componentElement>
</band>
</summary>
</jasperReport>
Thank you for reading this post.
If you find it useful, please hit the share button to help the community.
Cheers.!
Sadakar Pochampalli
This post will teach you how to work with 100% horizontal stacked highcharts bar chart in Jasper reports and how to work with Advanced properties of it.
I hope this would help some one in saving their(s) time.
Software used to test this example :
1) Jasper Design Studio 6.1
2) foodmart database of postgresql
3) Jasper Server 6.0.1 professional & Mozilla firefox web browser.
Sample output of the report :
I hope you have already knew how to create a new report hence skipping some basic steps and concentrating in explaining core parts.
1) Sample Query Design
SELECT
occupation,
state_province,
SUM(num_cars_owned) cars
FROM customer c
WHERE state_province IN('CA','WA','OR')
GROUP BY
occupation ,
state_province
ORDER BY
occupation,
state_province
2) Sample output of the query
3) Drag and drop "StackedPercBar" chart from HTML-5 charts component from Palette section.
4) Right click on it get the chart properties.
In chart data section & under configuration tab give below.
Category : $F{occupation} (of java.lang.String type)
Series : $F{state_province} (of java.lang.String type)
Measures : $F{cars} (of java.lang.Integer type)
5) Come back to the chart properties and click on Advanced Properties and click on "Add" button to add below properties.
plotOptions.series.dataLabels.enabled = ture
(Tick the check box) - to enable the values
plotOptions.series.dataLabels.format =" {point.percentage:.0f} % "
(tick the check box) - to get the %'s
plotOptions.series.dataLabels.color = #FF0000
(do not check the tick box) - to get the colors for values
See below image for accuracy
6) Save the report, publish it the server and have preview. Output should look as shown in first image to this post.
JRXML code : (copy paste the code to get the same copy in your JRXML source , note that it will only work in professional studio or iReport).
<?xml version="1.0" encoding="UTF-8"?>
<!-- Created with Jaspersoft Studio version 6.0.1.final using JasperReports Library version 6.0.0 -->
<!-- 2015-12-07T21:20:57 -->
<jasperReport xmlns="http://jasperreports.sourceforge.net/jasperreports" xmlns:xsi="http://www.w3.org/2001/XMLSchema-instance" xsi:schemaLocation="http://jasperreports.sourceforge.net/jasperreports http://jasperreports.sourceforge.net/xsd/jasperreport.xsd" name="Blank_A4_1" pageWidth="595" pageHeight="842" columnWidth="555" leftMargin="20" rightMargin="20" topMargin="20" bottomMargin="20" uuid="f8b9b5a2-390b-4136-94c7-00c39ec1a61d">
<property name="com.jaspersoft.studio.data.defaultdataadapter" value="foodmart"/>
<property name="ireport.jasperserver.url" value="http://localhost:8080/jasperserver-pro/"/>
<property name="ireport.jasperserver.user" value="superuser"/>
<property name="ireport.jasperserver.report.resource" value="/Explore/HTML5BarChart_files/main_jrxml"/>
<property name="ireport.jasperserver.reportUnit" value="/Explore/HTML5BarChart"/>
<queryString language="SQL">
<![CDATA[sELECT
occupation,
state_province,
SUM(num_cars_owned) cars
FROM customer c
WHERE state_province IN('CA','WA','OR')
GROUP BY
occupation ,
state_province
ORDER BY
occupation,
state_province
]]>
</queryString>
<field name="occupation" class="java.lang.String"/>
<field name="cars" class="java.lang.Long"/>
<field name="state_province" class="java.lang.String"/>
<background>
<band splitType="Stretch"/>
</background>
<summary>
<band height="340" splitType="Stretch">
<componentElement>
<reportElement x="0" y="0" width="555" height="340" uuid="b2a63a16-5851-438a-af78-98a11b27ddf3"/>
<hc:chart xmlns:hc="http://jaspersoft.com/highcharts" xsi:schemaLocation="http://jaspersoft.com/highcharts http://jaspersoft.com/schema/highcharts.xsd" type="StackedPercentBar">
<hc:chartSetting name="default">
<hc:chartProperty name="chart.zoomType">
<hc:propertyExpression><![CDATA["xy"]]></hc:propertyExpression>
</hc:chartProperty>
<hc:chartProperty name="credits.enabled">
<hc:propertyExpression><![CDATA[false]]></hc:propertyExpression>
</hc:chartProperty>
<hc:chartProperty name="credits.href">
<hc:propertyExpression><![CDATA[""]]></hc:propertyExpression>
</hc:chartProperty>
<hc:chartProperty name="credits.text">
<hc:propertyExpression><![CDATA[""]]></hc:propertyExpression>
</hc:chartProperty>
<hc:chartProperty name="legend.enabled">
<hc:propertyExpression><![CDATA[boolean.FALSE]]></hc:propertyExpression>
</hc:chartProperty>
<hc:chartProperty name="plotOptions.series.allowPointSelect">
<hc:propertyExpression><![CDATA[boolean.TRUE]]></hc:propertyExpression>
</hc:chartProperty>
<hc:chartProperty name="plotOptions.series.connectNulls">
<hc:propertyExpression><![CDATA[boolean.TRUE]]></hc:propertyExpression>
</hc:chartProperty>
<hc:chartProperty name="plotOptions.series.dataLabels.color" value="#FF0000"/>
<hc:chartProperty name="plotOptions.series.dataLabels.enabled">
<hc:propertyExpression><![CDATA[true]]></hc:propertyExpression>
</hc:chartProperty>
<hc:chartProperty name="plotOptions.series.dataLabels.format">
<hc:propertyExpression><![CDATA[" {point.percentage:.0f} % "]]></hc:propertyExpression>
</hc:chartProperty>
<hc:chartProperty name="plotOptions.series.selected">
<hc:propertyExpression><![CDATA[boolean.TRUE]]></hc:propertyExpression>
</hc:chartProperty>
<hc:chartProperty name="plotOptions.series.showCheckBox">
<hc:propertyExpression><![CDATA[boolean.TRUE]]></hc:propertyExpression>
</hc:chartProperty>
<hc:chartProperty name="title.text">
<hc:propertyExpression><![CDATA[""]]></hc:propertyExpression>
</hc:chartProperty>
<hc:chartProperty name="yAxis.title.text">
<hc:propertyExpression><![CDATA[""]]></hc:propertyExpression>
</hc:chartProperty>
</hc:chartSetting>
<multiAxisData>
<multiAxisDataset/>
<dataAxis axis="Rows">
<axisLevel name="Level1">
<labelExpression><![CDATA["Level Label expression"]]></labelExpression>
<axisLevelBucket class="java.lang.String">
<bucketExpression><![CDATA[$F{occupation}]]></bucketExpression>
</axisLevelBucket>
</axisLevel>
</dataAxis>
<dataAxis axis="Columns">
<axisLevel name="state_province">
<labelExpression><![CDATA[]]></labelExpression>
<axisLevelBucket order="None" class="java.lang.String">
<bucketExpression><![CDATA[$F{state_province}]]></bucketExpression>
</axisLevelBucket>
</axisLevel>
</dataAxis>
<multiAxisMeasure name="cars" class="java.lang.Integer" calculation="Nothing">
<labelExpression><![CDATA["Measure label expression"]]></labelExpression>
<valueExpression><![CDATA[$F{cars}]]></valueExpression>
</multiAxisMeasure>
</multiAxisData>
<hc:series name="cars"/>
</hc:chart>
</componentElement>
</band>
</summary>
</jasperReport>
Thank you for reading this post.
If you find it useful, please hit the share button to help the community.
Cheers.!
Sadakar Pochampalli
Recommended Comments
There are no comments to display.